| ... | ... | @@ -21,13 +21,20 @@ The Geobrowser displays a large world map, tool panel at left hand side, a layer |
|
|
|
The data catalogue is accessible on the left hand side panel. You can select the data collection with the pull-down menu.
|
|
|
|
To select an Area of Interest (AOI), use the menu on the top banner. Click on the "finger" icon to deactivate the AOI drawing mode.
|
|
|
|
|
|
|
|
<img src="https://gitlab.acri-cwa.fr/coastal-tep/tutorial/raw/master/images/part1/im2.png" width="30%" style="float: right;" ><img src="https://gitlab.acri-cwa.fr/coastal-tep/tutorial/raw/master/images/part1/im3.png" width="60%" style="float: left;">
|
|
|
|
<img src="https://gitlab.acri-cwa.fr/coastal-tep/tutorial/raw/master/images/part1/im2.png" width="30%" style="float: left;" ><img src="https://gitlab.acri-cwa.fr/coastal-tep/tutorial/raw/master/images/part1/im3.png" width="60%" style="float: right;">
|
|
|
|
|
|
|
|
You can define a period of interest with the calendar tool. Some data sets have additional filtering parameters available.
|
|
|
|
|
|
|
|
Let's look for products over Venice in the month of March 2017:
|
|
|
|
|
|
|
|

|
|
|
|
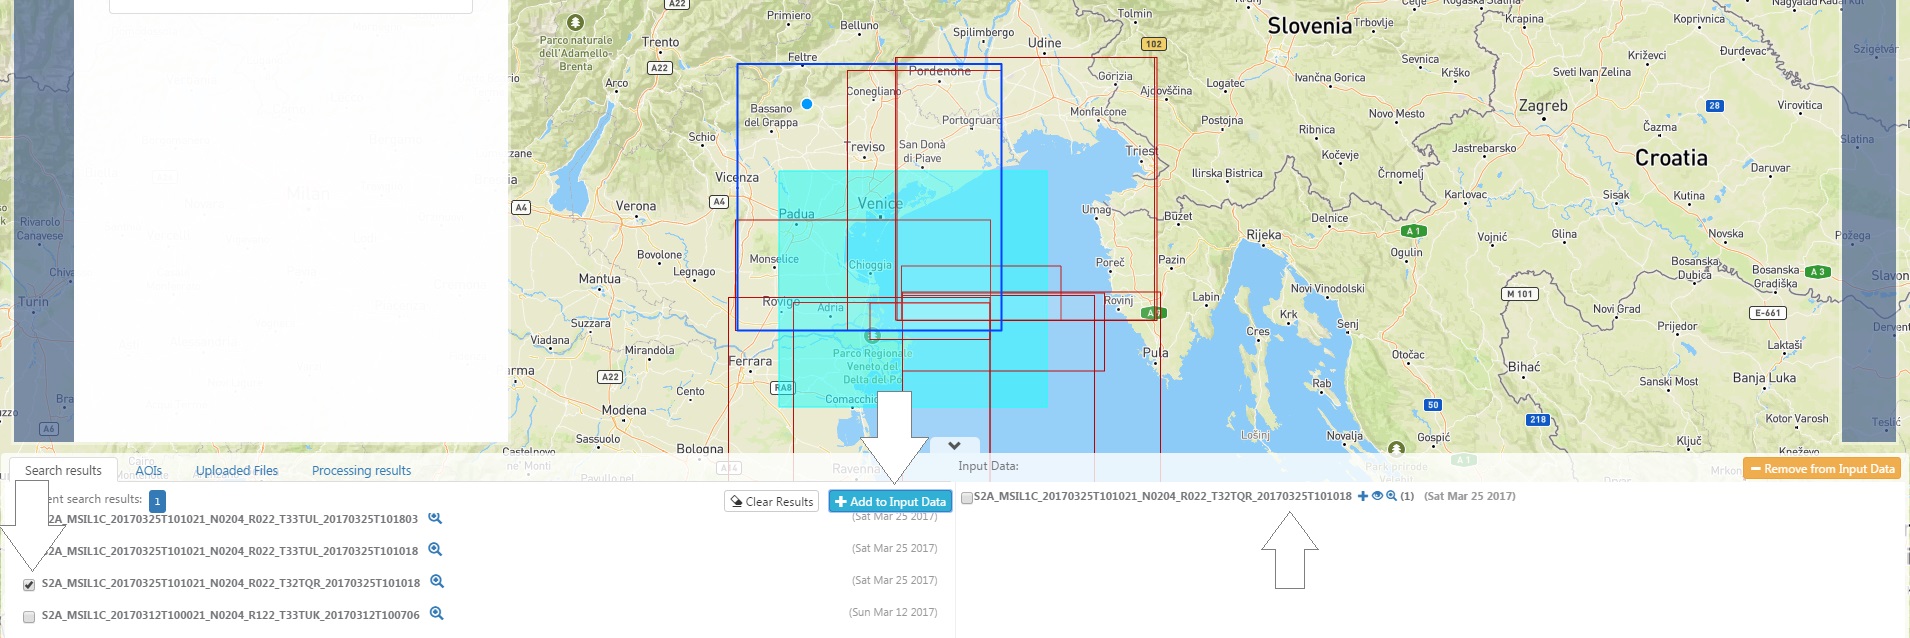
The result should be similar with the image below.
|
|
|
|
|
|
|
|
We can select for example tile 32TQR acquired on March 25th. Move your mouse over the different products to visualize the footprint of the product.
|
|
|
|
|
|
|
|
Once you have made your choice, you can place this product in the Input Data clipboard. The clipboard is the place where you can store input data that you want to use for processing. To place products on the clipboard, check the corresponding checkboxes and press "Add to Input Data".
|
|
|
|
|
|
|
|
|
|
|
|
|
|
|
|
4. Select a rectangular area of interest in Venice area (Click on “Rectangular” option from the “Area of interest” menu and draw an rectangle on the map covering the area of interest).
|
|
|
|

|
|
|
|
The result should be similar with the image below.
|
| ... | ... | |