| Go to Part 2: Sen2Cor processor |
|---|
Introduction
GeoBrowser is part of an online system (server + client) developed in the framework of the Coastal Thematic Exploitation Platform (CTEP) project.
The data accessing and processing operations are based on open standards, developed by Open Geospatial Consortium (OGC), such as:
- Web Map Service (WMS)
- Web Feature Service (WFS)
- Web Coverage Service (WCS)
- Catalogue Service (CSW)
- Web Processing Service (WPS)
These services are compatible with the following network services defined by the European INSPIRE initiative:
- Search (allow the geospatial data sets and services identification, based on the content of the corresponding metadata, and metadata content visualisation)
- Visualization (allow the displaying, navigation, zooming, panoramic rotation, visual overlapping of spatial data sets and displaying of explanatory information and of any pertinent content of the metadata)
- Download (allow complete or partial download of spatial data sets and direct access to these) and processing (allow the processing of the spatial data sets).
The system can be accessed by the users via internet, using a web navigator (browser) at: http://213.244.27.15/geobrowser.
The system’s compatibility has been successfully tested on Windows (8, 10), Linux (Ubuntu 14.x, 16.x) and MacOS X (Yosemite, El Capitan) platforms, using Mozilla Firefox, Chrome, Safari, Microsoft Edge and Opera. Internet Explorer users can also use the application but some errors might occur. Minimum required resolution for system use is 1024x768. The browsers should apriori be set to allow the pop-up windows, JavaScript scripts running and cascade style display (CSS).
The tutorial aims to teach the users how to use the CTEP GeoBrowser through different cases. It is divided into 3 parts :
- How to access CTEP GeoBrowser and navigate
- How to use Sen2Cor processor (create Sentinel-2 Level 2A products from Level 1C input data)
- How to plot timeseries from extracted points coordinates (GlobColour data)
Part 1 - Access CTEP GeoBrowser and navigate
- Open a web browser and insert the following URL: http://213.244.27.15/geobrowser. The result should be similar with the image bellow.
![im1]()
- Zoom to Mediterranean Sea using the “Zoom to” control from the toolbar.
![im2]() The result should be similar with the image bellow.
The result should be similar with the image bellow.
![im3]()
- Further zoom to the Adriatic Sea (click and drag a rectangle defining the area on which to zoom in) and further to Venice.
![im4]() The result should be similar with the image bellow.
The result should be similar with the image bellow.
![im5]()
- Select a rectangular area of interest in Venice area (Click on “Rectangular” option from the “Area of interest” menu and draw an rectangle on the map covering the area of interest).
![im6]() The result should be similar with the image bellow.
The result should be similar with the image bellow.
![im7]()
- Open the Catalogue panel by clicking on the Catalogue icon on the left screen side panel bar.
![im8]() The result should be similar with the image bellow.
The result should be similar with the image bellow.
![im9]()
- Re-center the map to better display the selected area of interested.
![im10]()
- Choose a dataset in the collection. Here Sentinel-2.
![im11]()
- Select 20.01.2016 as starting date.
![im12]()
- Select 22.01.2016 as a end date.
![im13]()
- Click on the Search button.
![im14]()
- The Sentinel-2 products that match the search criteria’s are listed in the Catalogue panel. The product footprints are displayed on the map.
![im15]()
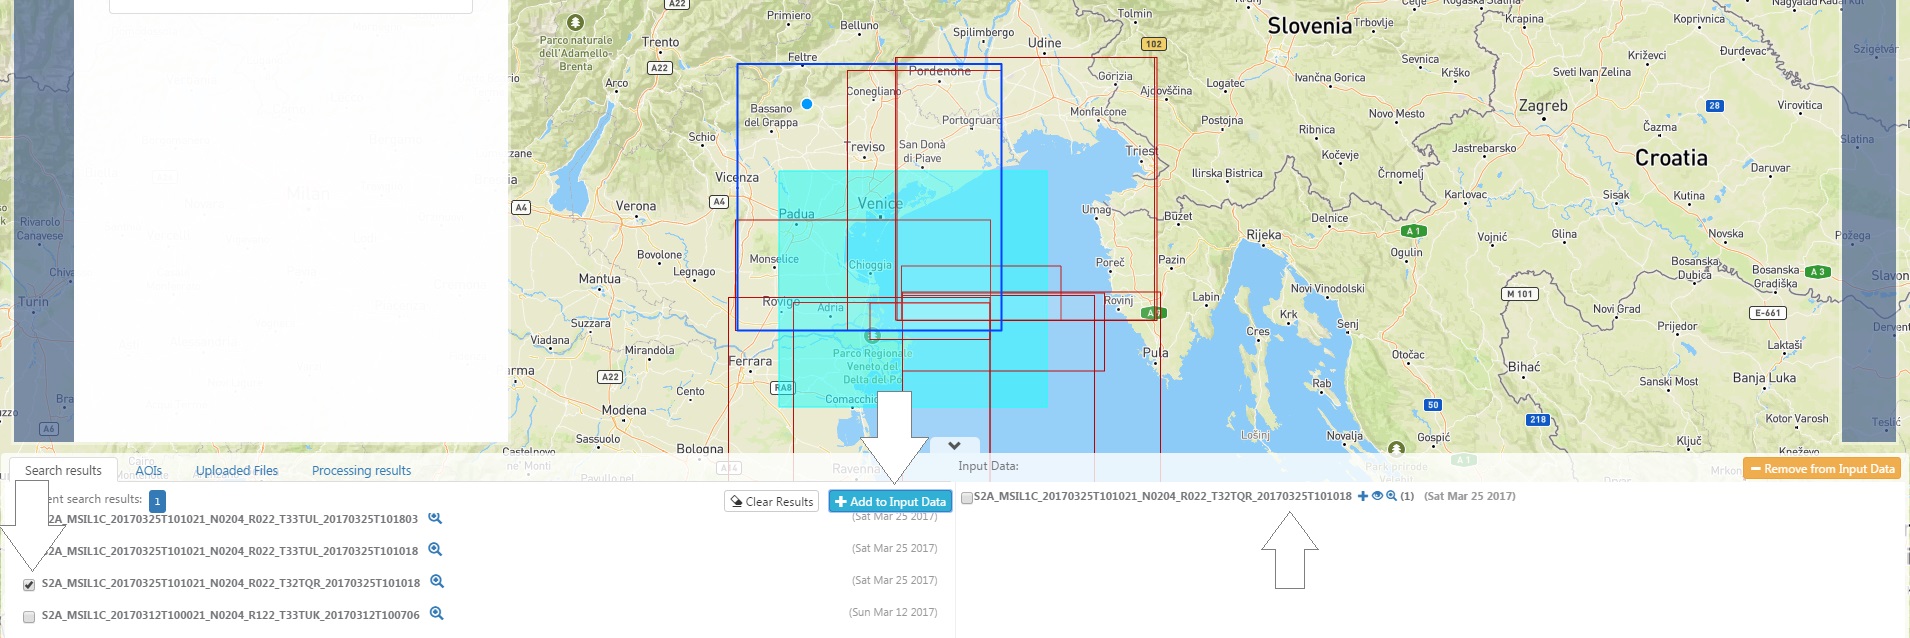
- The results of the query are in the bottom panel. (The footprints are highlighted with green when the mouse is over the list in the left and with blue for the checked products). Select a product (centered on Venice in this example).
![im16]()
- Add the selected product to “My data” section by clicking on the “+ Add to My Data” icon.
![im17]() The selected product is now located in your data in the right part of the bottom panel.
The selected product is now located in your data in the right part of the bottom panel.
![im18]()


| Go to Part 2: Sen2Cor processor |
|---|