| Next: Adding Layers |
|---|
Introduction
All CTEP services can be accessed using a web browser. The system’s compatibility has been successfully tested on Windows (8, 10), Linux (Ubuntu 14.x, 16.x) and MacOS X (Yosemite, El Capitan) platforms, using Mozilla Firefox, Chrome, Safari, Microsoft Edge and Opera. Internet Explorer users can also use the application but some errors might occur. Minimum required resolution for system use is 1024x768. The browsers should apriori be set to allow the pop-up windows, JavaScript scripts running and cascade style display (CSS).
The tutorial aims to teach the users how to use the CTEP GeoBrowser through different cases. It is divided into 3 parts :
- How to access CTEP GeoBrowser and navigate
- How to run a processor (taking as example of the Sen2cor Level-2 processor for Sentinel-2)
- How to upload and run your own processor
Part 1 - Access CTEP GeoBrowser and navigate
The Geobrowser is the main interface of the CTEP. It is accessible at https://coastal-tep.eo.esa.int/geobrowser/ The Geobrowser displays a large world map, tool panel at left hand side, a layer panel at the right hand side, and a data panel at the bottom. You can nagvigate on the map using the mouse and "+" / "-" buttons near the left hand side panel. Some predefined areas are accessible from the top banner (menu accessible with the magnifier icon).

The data catalogue is accessible on the left hand side panel. You can select the data collection with the pull-down menu. To select an Area of Interest (AOI), use the menu on the top banner. Click on the "finger" icon to deactivate the AOI drawing mode.


You can define a period of interest with the calendar tool. Some data sets have additional filtering parameters available.
Let's look for products over Venice in the month of March 2017:

We can select for example tile 32TQR acquired on March 25th. Move your mouse over the different products to visualize the footprint of the product.
Once you have made your choice, you can place this product in the Input Data clipboard. The clipboard is the place where you can store input data that you want to use for processing. To place products on the clipboard, check the corresponding check-boxes and press "Add to Input Data".
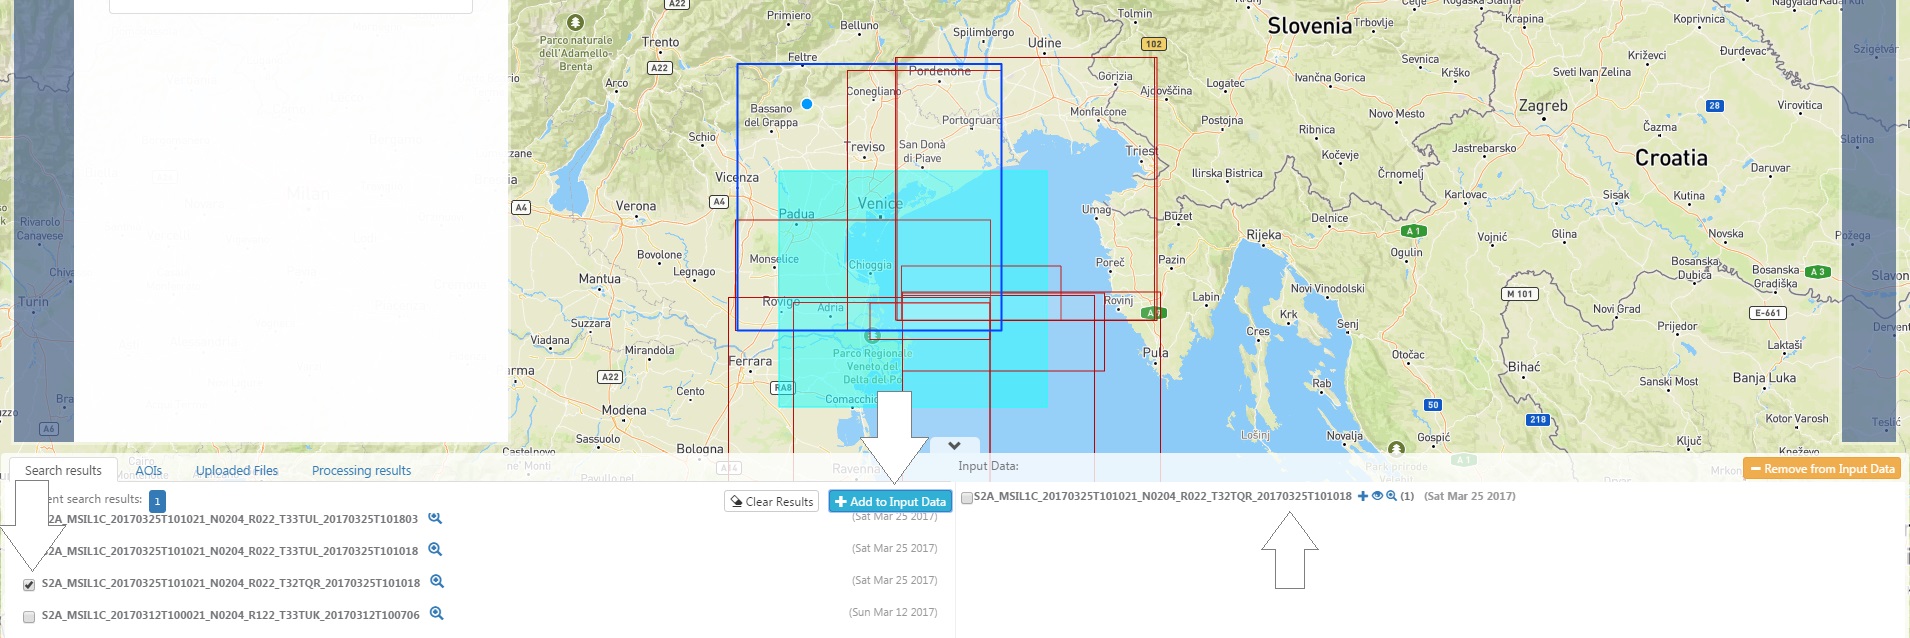
Once this is done you can clear the search results. You can visualize the footprint of the product by clicking on the "eye" icon.

| Next: Adding Layers |
|---|