Part 2 - Upload an run your own processor
- Open a web browser and insert the following URL: http://213.244.27.15/geobrowser. The result should be similar with the image bellow.
![im1]()
- Zoom to Mediterranean Sea using the “Zoom to” control from the toolbar.
![im2]() The result should be similar with the image bellow.
The result should be similar with the image bellow.
![im3]()
- Further zoom to the Adriatic Sea (click and drag a rectangle defining the area on which to zoom in) and further to Venice.
![im4]() The result should be similar with the image bellow.
The result should be similar with the image bellow.
![im5]()
- Select a rectangular area of interest in Venice area (Click on “Rectangular” option from the “Area of interest” menu and draw an rectangle on the map covering the area of interest).
![im6]() The result should be similar with the image bellow.
The result should be similar with the image bellow.
![im7]()
- Open the Catalogue panel by clicking on the Catalogue icon on the left screen side panel bar.
![im8]() The result should be similar with the image bellow.
The result should be similar with the image bellow.
![im9]()
- Re-center the map to better display the selected area of interested.
![im10]()
- Choose a dataset in the collection. Here Sentinel-2.
![im11]()
- Select 20.01.2016 as starting date.
![im12]()
- Select 22.01.2016 as a end date.
![im13]()
- Click on the Search button.
![im14]()
- The Sentinel-2 products that match the search criteria’s are listed in the Catalogue panel. The product footprints are displayed on the map.
![im15]()
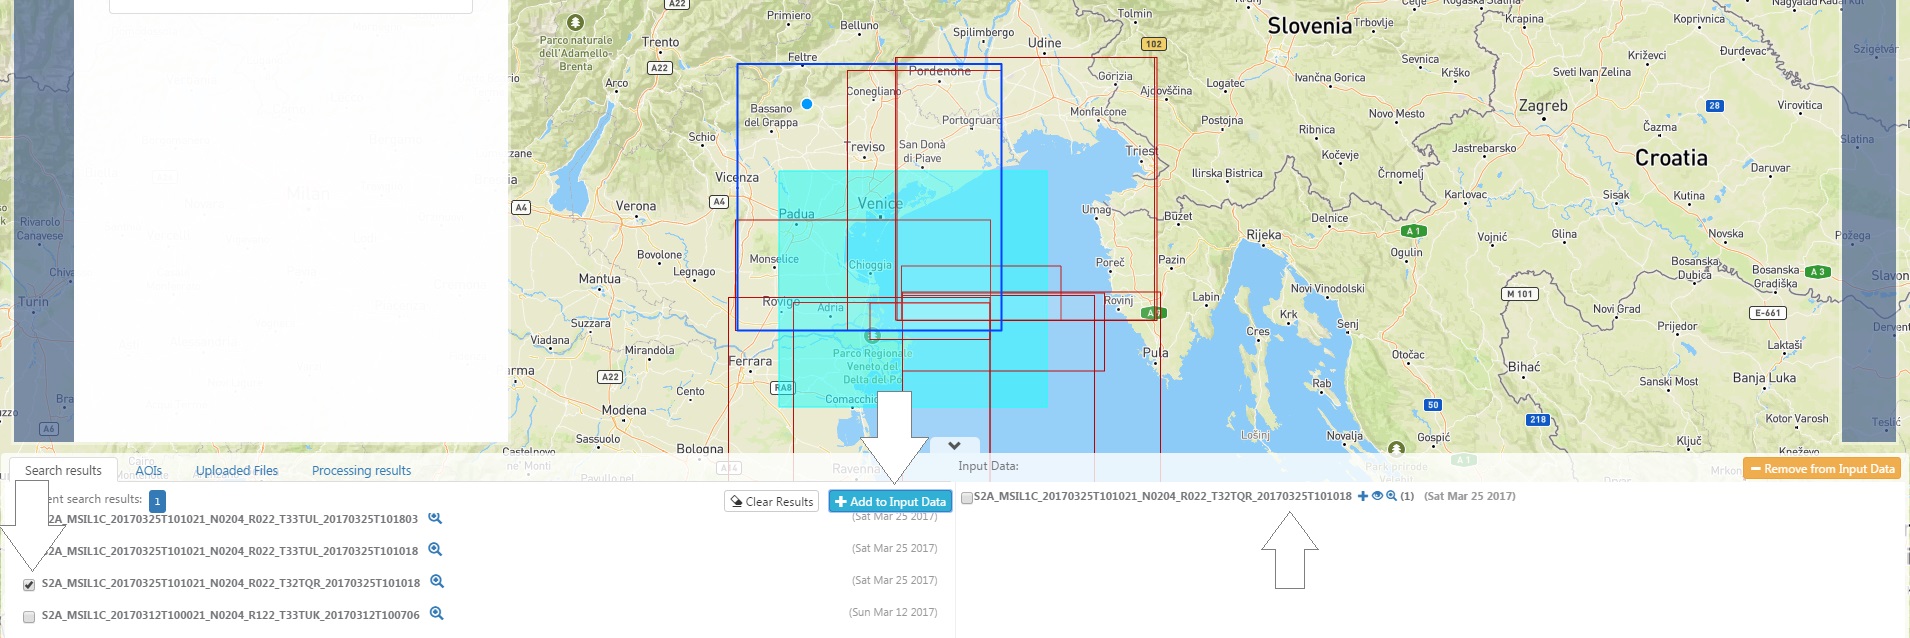
- The results of the query are now in the left side of the bottom panel. (The footprints are highlighted with green when the mouse is over the list in the left and with blue for the checked products). Select a product (centered on Venice in this example).
![im16]()
- Add the selected product to “My data” section by clicking on the “+ Add to My Data” icon.
![im17]() The selected product is now located in your data in the right part of the bottom panel.
The selected product is now located in your data in the right part of the bottom panel.
![im18]()